您现在的位置是:首页 > 云原生 > Kubernetes > 正文
Kubernetes
kubernetes中服务自定义Prometheus的metrics的方法
本文主要是记录实现在kubernetes集群里golang服务在Prometheus里自定义metrics的实现方法。
客户端调用实例
这里使用golang的服务来实现,具体代码如下:
package main

import (
  "log"
  "math/rand"
  "time"

  "github.com/gin-gonic/gin"
  "github.com/prometheus/client_golang/prometheus"
  "github.com/prometheus/client_golang/prometheus/promhttp"
)

var (
  counter = prometheus.NewCounter(
    prometheus.CounterOpts{
      Namespace: "prometheus_app_test",
      Name:      "app_counter",
      Help:      "app counter help",
    })

  gauge = prometheus.NewGauge(
    prometheus.GaugeOpts{
      Namespace: "prometheus_app_test",
      Name:      "app_gauge",
      Help:      "app gauge help",
    })

  histogram = prometheus.NewHistogram(
    prometheus.HistogramOpts{
      Namespace: "prometheus_app_test",
      Name:      "app_histogram",
      Help:      "app histogram help",
    })

  summary = prometheus.NewSummary(
    prometheus.SummaryOpts{
      Namespace: "prometheus_app_test",
      Name:      "app_summary",
      Help:      "app summary help",
    })
)

func prometheusHandler() gin.HandlerFunc {
  h := promhttp.Handler()
  return func(c *gin.Context) {
    h.ServeHTTP(c.Writer, c.Request)
  }
}

func main() {
  prometheus.MustRegister(counter)
  prometheus.MustRegister(gauge)
  prometheus.MustRegister(histogram)
  prometheus.MustRegister(summary)

  router := gin.New()
  router.Use(gin.Recovery())
  router.GET("/metrics", prometheusHandler())
  go func() {
    rand.Seed(time.Now().Unix())
    for {
      counter.Add(rand.Float64() * 5)
      gauge.Add(rand.Float64()*15 - 5)
      histogram.Observe(rand.Float64() * 10)
      summary.Observe(rand.Float64() * 10)
      time.Sleep(5 * time.Second)
    }
  }()
  if err := router.Run(":8080"); err != nil {
    log.Fatal(err)
  }
}
部署服务到kubernetes集群
这里使用手工打镜像,手工写yaml的方式来进行操作,实际生产环境建议使用CI/CD系统来完成。
Dockerfile文件:
FROM alpine
RUN apk add -U tzdata && \
ln -sf /usr/share/zoneinfo/Asia/Shanghai  /etc/localtime && \
mkdir -p /data/app/
ADD app-prometheus /data/app/
WORKDIR /data/app/
CMD ["./app-prometheus"]
本地构建脚本:
#!/bin/bash
set -e

GOOS=linux GOARCH=amd64 go build -o app-prometheus main.go

export IMAGE=registry.5bug.wang/test/app-prometheus:1.0
docker build -t ${IMAGE} .
docker push ${IMAGE}
yaml文件:
apiVersion: apps/v1
kind: Deployment
metadata:
  name: app-prometheus
  labels:
    app: app-prometheus
spec:
  replicas: 1
  selector:
    matchLabels:
      app: app-prometheus
  template:
    metadata:
        annotations:
            prometheus.io/scrape: "true"
            prometheus.io/path: /metrics
            prometheus.io/port: "8080"
        labels:
            app: app-prometheus
    spec:
      containers:
      - name: app-prometheus
        image: "registry.5bug.wang/test/app-prometheus:1.0"
上面yaml里最关键的部分就是annotations下的三个选项,只有开启了才会被采集到数据:
prometheus.io/scrape: "true"
prometheus.io/path: /metrics
prometheus.io/port: "8080"
执行kubectl apply -f prometheus.yaml进行部署服务。
查看自定义监控指标
在prometheus系统里可以查看对应的Target,搜索关键词,如下图:
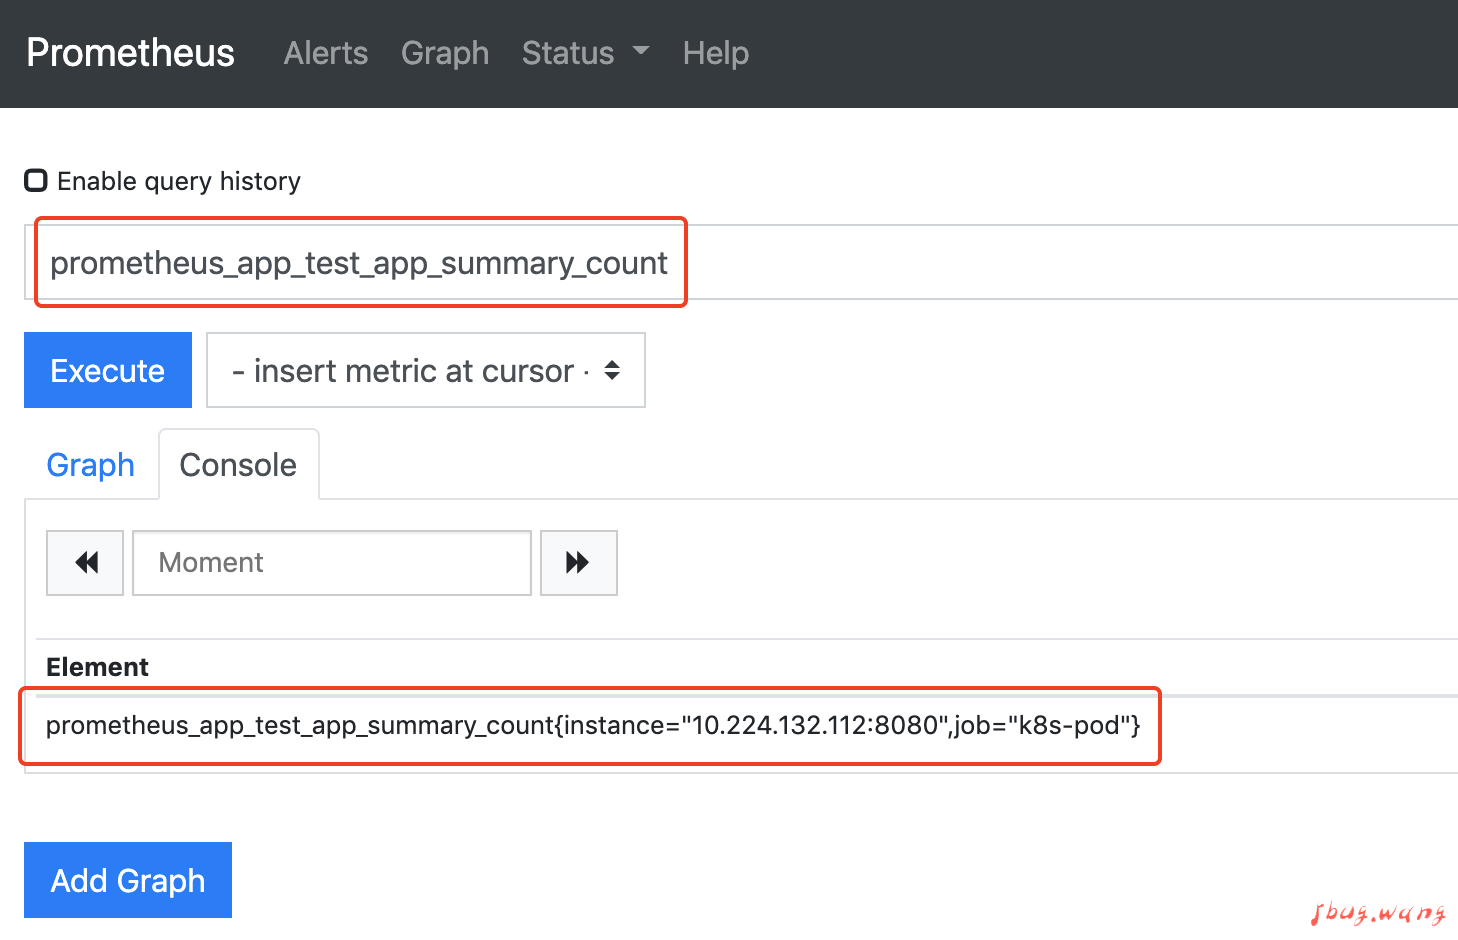
如果这里搜索不到,说明指标数据没有被prometheus采集到,需要修改prometheus的配置文件,关键配置如下:
        relabel_configs:
        - source_labels: [__meta_kubernetes_pod_annotation_prometheus_io_scheme]
          action: replace
          target_label: __scheme__
          regex: (https?)
        - source_labels: [__meta_kubernetes_pod_annotation_prometheus_io_scrape]
          action: keep
          regex: true
        - source_labels: [__meta_kubernetes_pod_annotation_prometheus_io_path]
          action: replace
          target_label: __metrics_path__
          regex: (.+)
        - source_labels: [__address__, __meta_kubernetes_pod_annotation_prometheus_io_port]
          action: replace
          target_label: __address__
          regex: ([^:]+)(?::\d+)?;(\d+)
          replacement: $1:$2


相关文章
- 在Kubernetes里使用openkruise实现服务原地升级功能
- 吾八哥学k8s(十一):kubernetes里Pod的调度机制
- 吾八哥学k8s(十):kubernetes里Service和Ingress
- k8s集群安装Prometheus监控以及Grafana面板的方法
- kubernetes集群证书过期的解决方法
- kubelet启动失败报failed to find cgroups of kubelet的解决方法
- 吾八哥学k8s(九):kubernetes里持久化存储
- macOs和Linux环境下kubectl命令自动补齐的方法
- 吾八哥学k8s(八):kubernetes里Secret的用法
- apps/v1版本下使用client-go实现kubernetes回滚的方法